Quick Scans
An easy-to-use software platform that allows you
to scan market data seamlessly, identifying historical trends that match your search criteria.

Scanning for historical seasonal trends is simply done by interacting with the paragraph as shown above.
- Search for trends by month or for a specific symbol
- Define the minimum historical accuracy (ie. 80% historical win percentage over ten years would mean at least 8 out of the last 10 years would have to have been in line with the seasonal trend.)
- Narrow or Expand the trading days. This indicates the duration of the number of days you want the trend to be (ie. 15 trading days to 45 trading days is looking for trends that last three weeks to nine weeks.)
- Select how many years to look back. This option allows you to set the minimum number of years TradeMiner will look back to find historical trends.
- Filters weed out overlapping trends (i.e. trends that start on the same day but end on different days or if they overlap at all.)
Selecting “Dig Now” will scan through the Historical Database and identify the trends and cycles that meet your criteria.
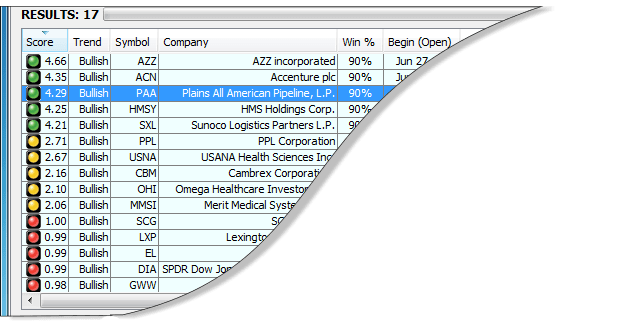
TradeMiner will rank the historical results according to a proprietary ranking system. This system ranks higher the picks with the greatest historical gains in the shortest amount of time, with the least amount of historical risk.
The score ranking works on a scale from zero to five, and includes an easy-to-read, color coded key.
